Loan Analytics Power BI Dashboard
Project Overview
This project focuses on performing Exploratory Data Analysis (EDA) on loan application data using Microsoft Power BI. The goal was to understand customer demographics, loan approval trends, and default risk patterns through a series of interactive visual dashboards. By combining Power Query for data cleaning and transformation with dynamic Power BI visuals, this project uncovers insights into how factors like education level, income type, gender, and contract type influence loan approval outcomes. The analysis is structured into three key dashboards – Application Data, Previous Applications, and Risk Analysis – each highlighting unique aspects of customer behavior and financial decision-making.
Technologies & Skills Showcased
⚡ Power BI
⚡ Power Query
⚡ DAX
⚡ Data Modeling
⚡ Financial Analytics
Dashboard Screenshots
Dashboard Components
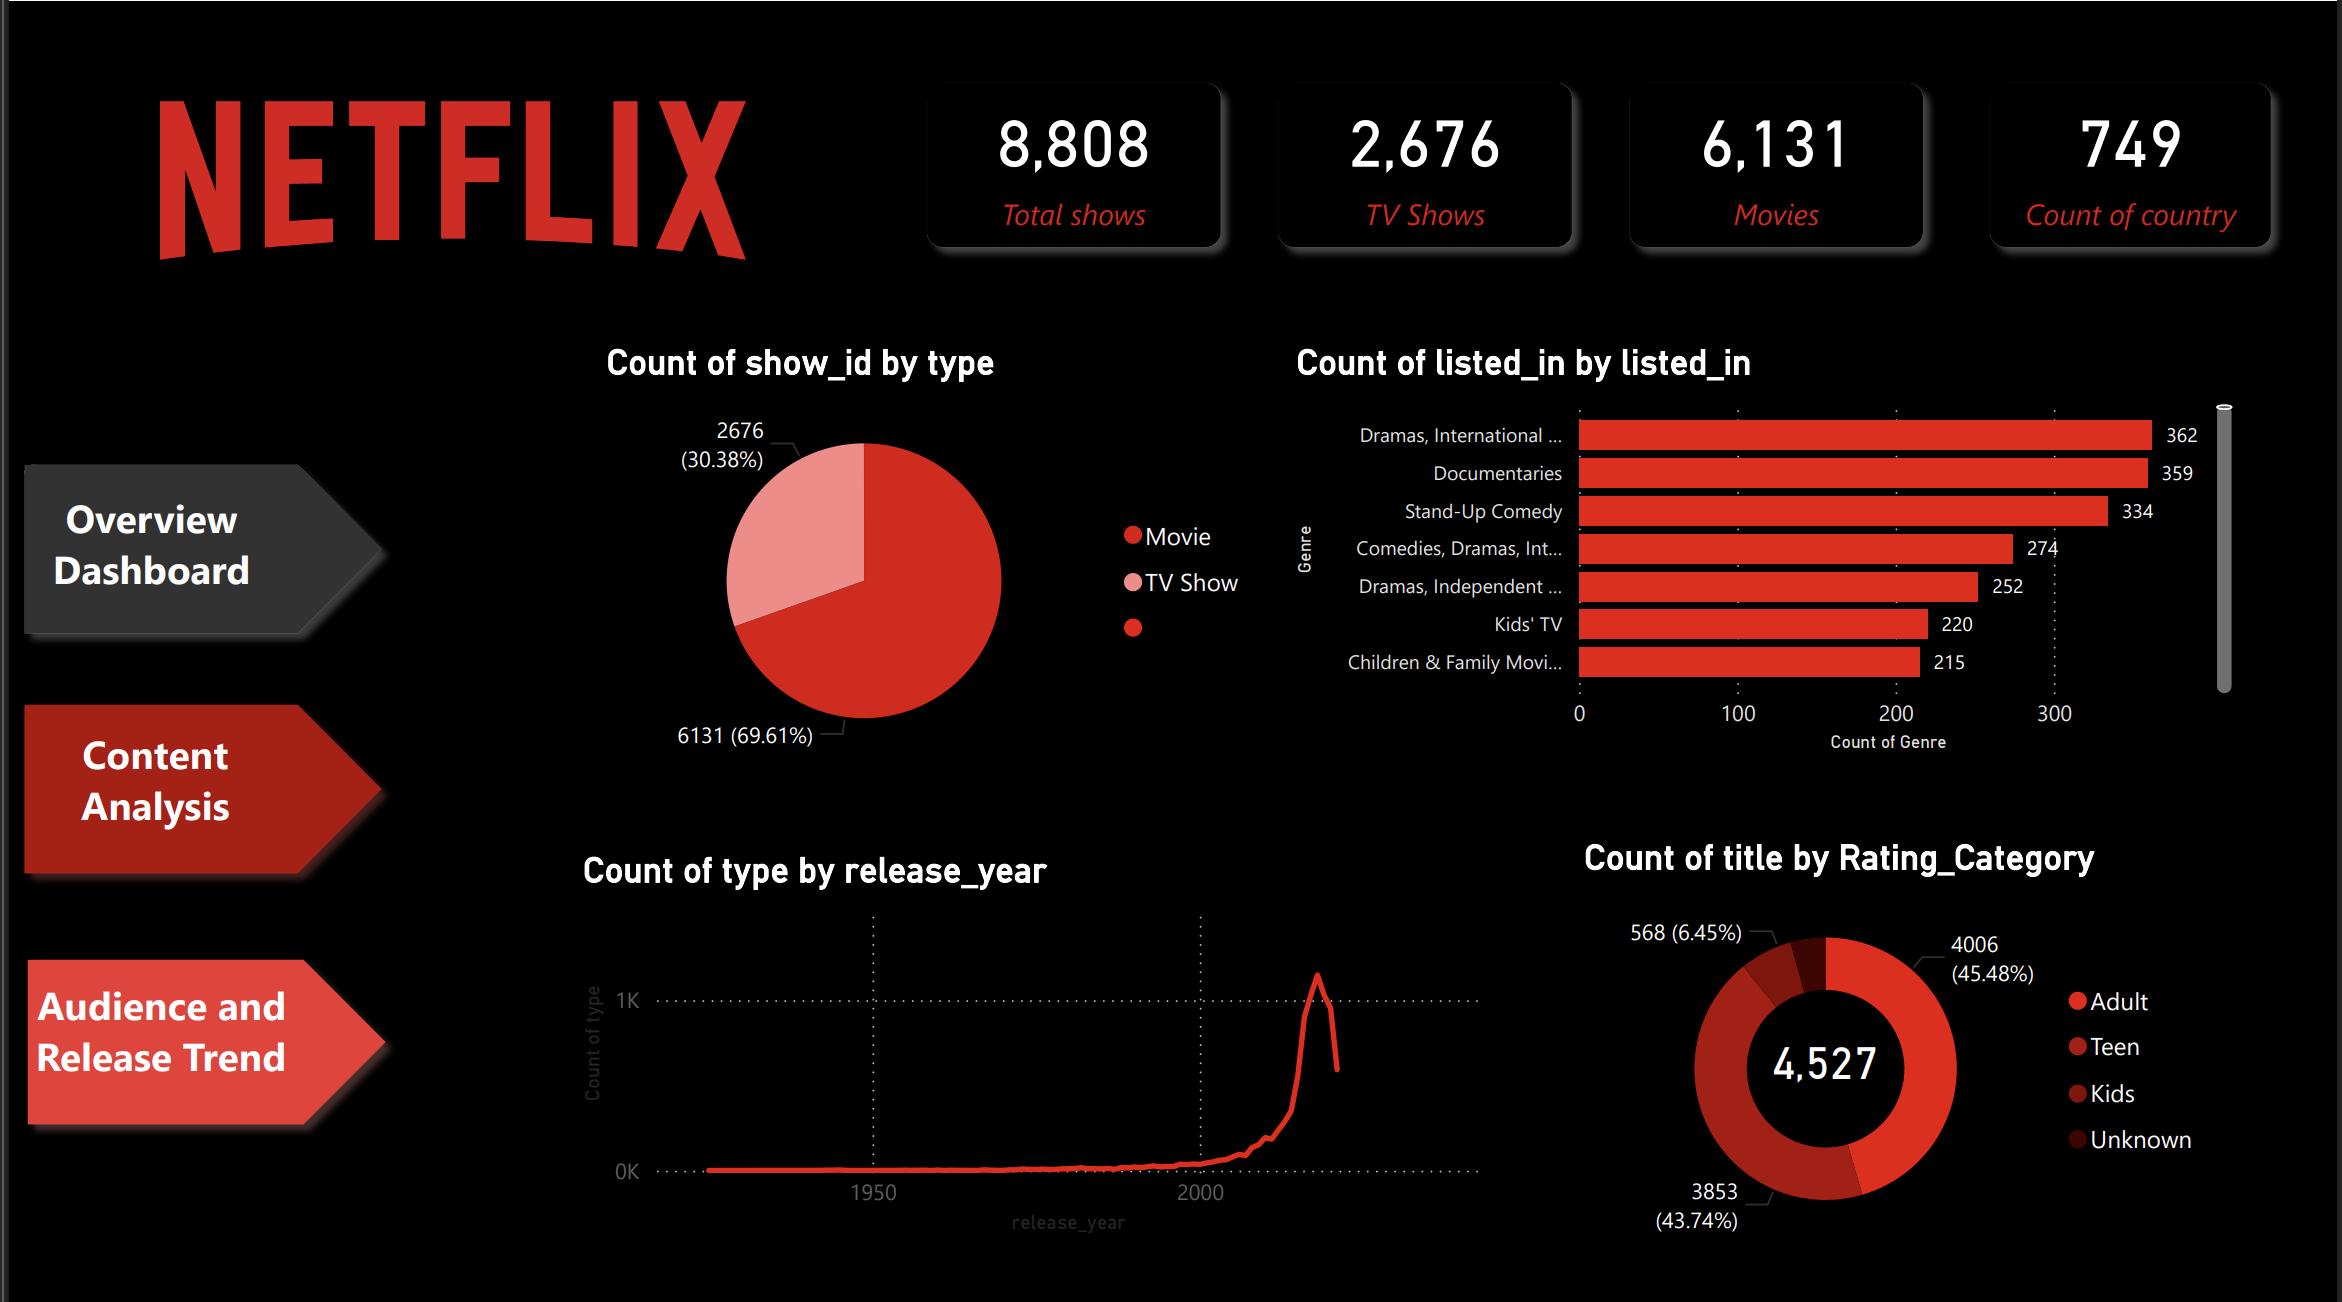
Application Data
Customer demographics and loan approval trends analysis
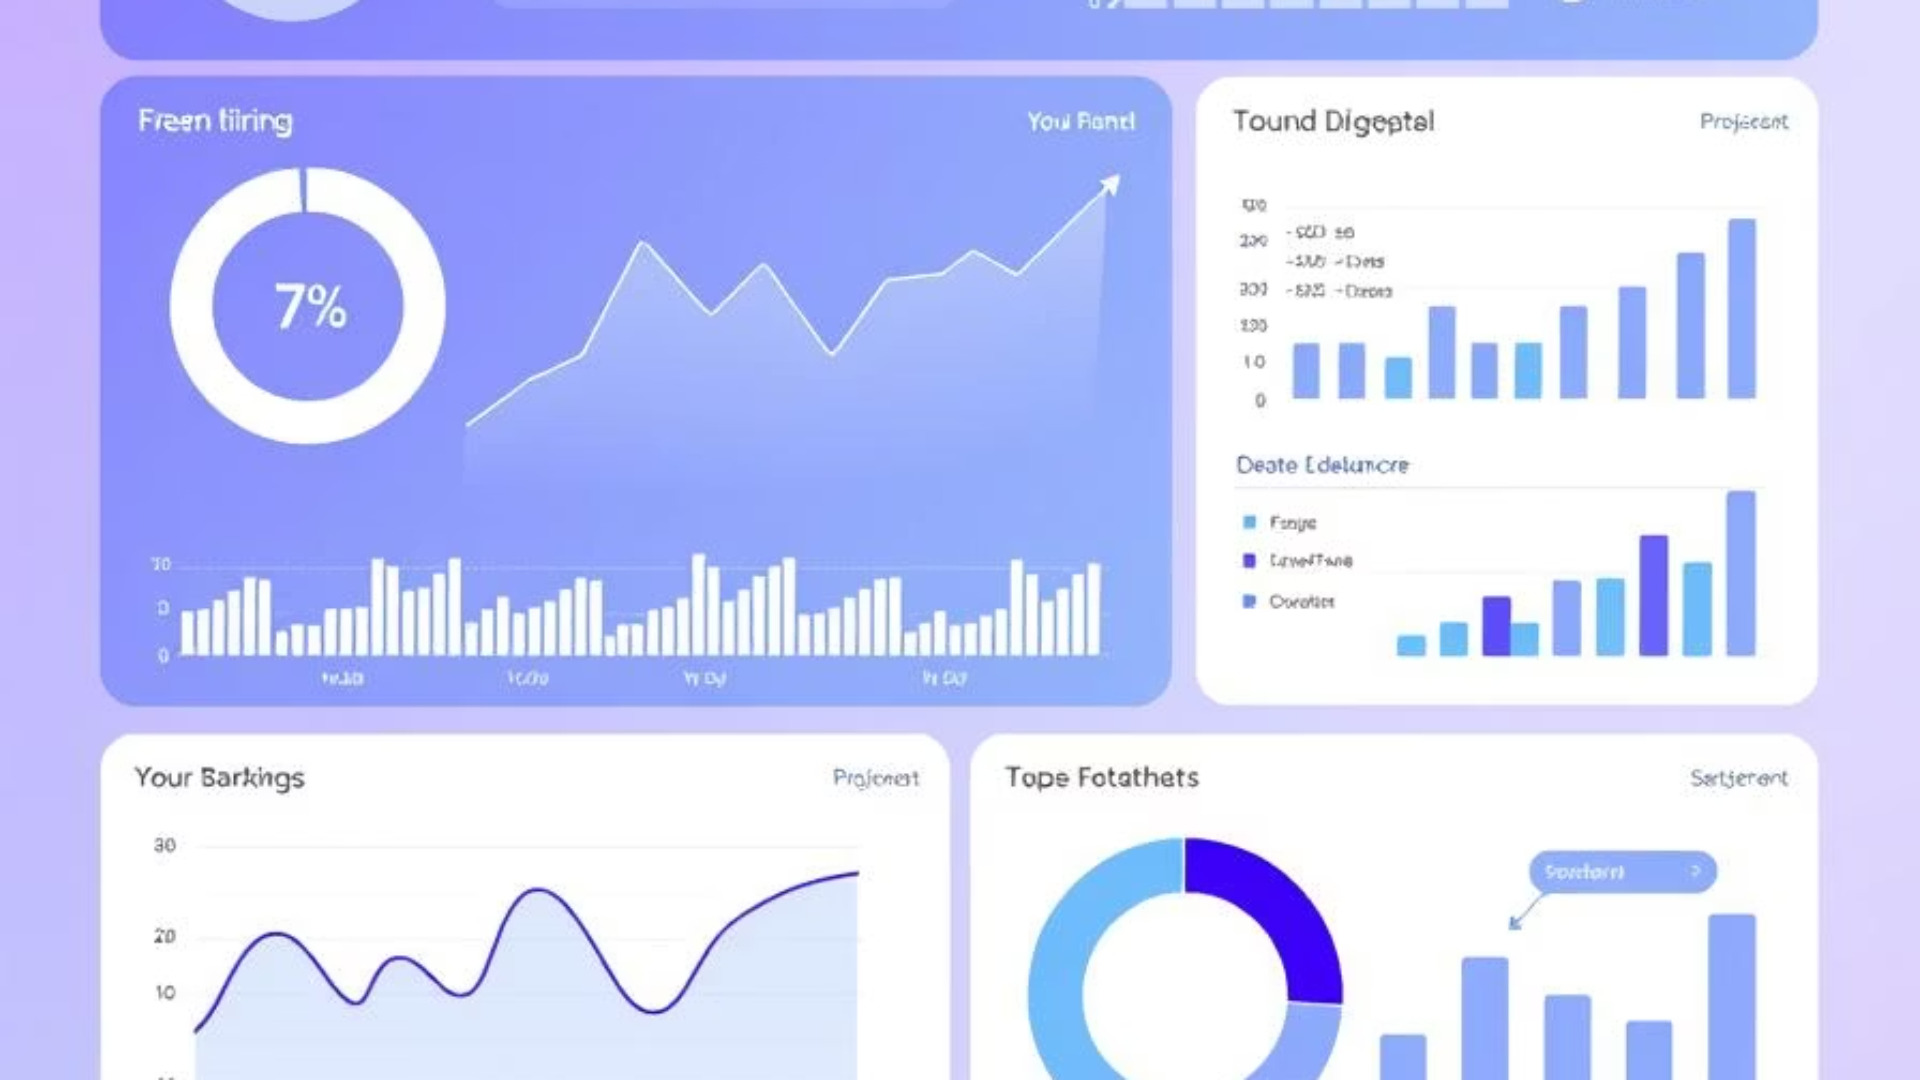
Previous Applications
Historical application patterns and behavior tracking
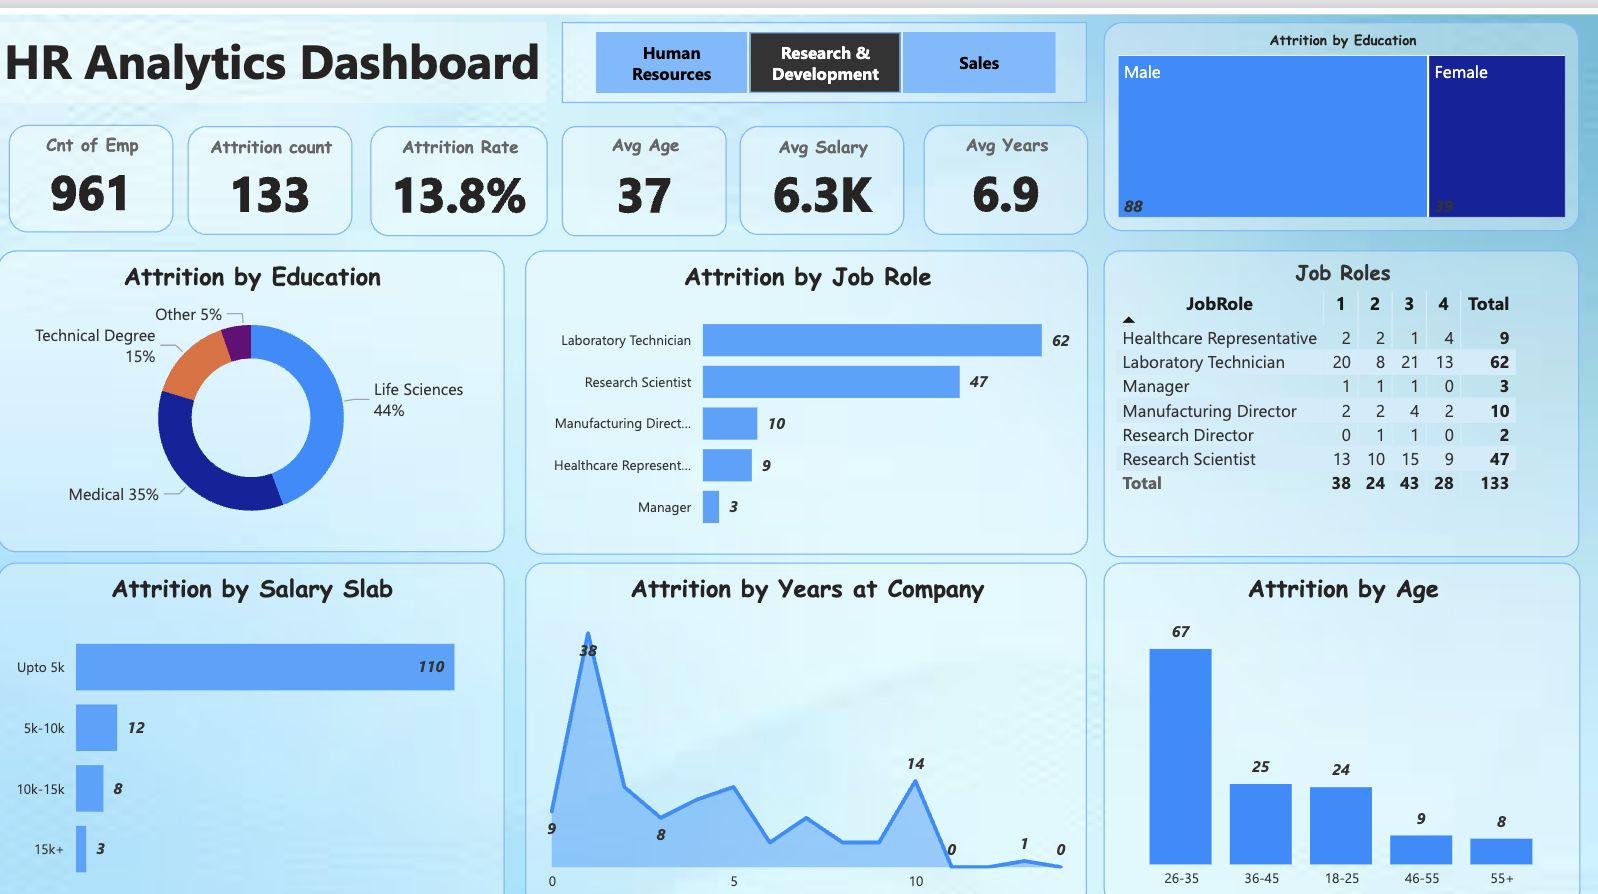
Risk Analysis
Default risk patterns and predictive indicators
What I Learned
Working on this project enhanced my data visualization and storytelling skills in Power BI while deepening my understanding of loan analytics. Key learnings include:
- Using Power Query for efficient data cleaning, merging, and transformation
- Applying KPI cards, slicers, and filters to create interactive, user-friendly dashboards
- Analyzing approval and rejection patterns across gender, education, and income types
- Interpreting default risk by comparing current and previous loan applications
- Designing dashboards that not only present data but also communicate actionable insights
This project strengthened my ability to translate complex financial data into clear, visually engaging stories, showcasing the real power of Power BI in decision-making analytics.